The State of TikTok Shop 2026
Most products on TikTok Shop barely sell. We read 6,057 products from TikTok Shop search in the US and UK, a month before Black Friday: what they cost, how often they're discounted, how much they've sold, and which ones come with a creator's video.
Contents
Key Findings
A few products take almost all the sales
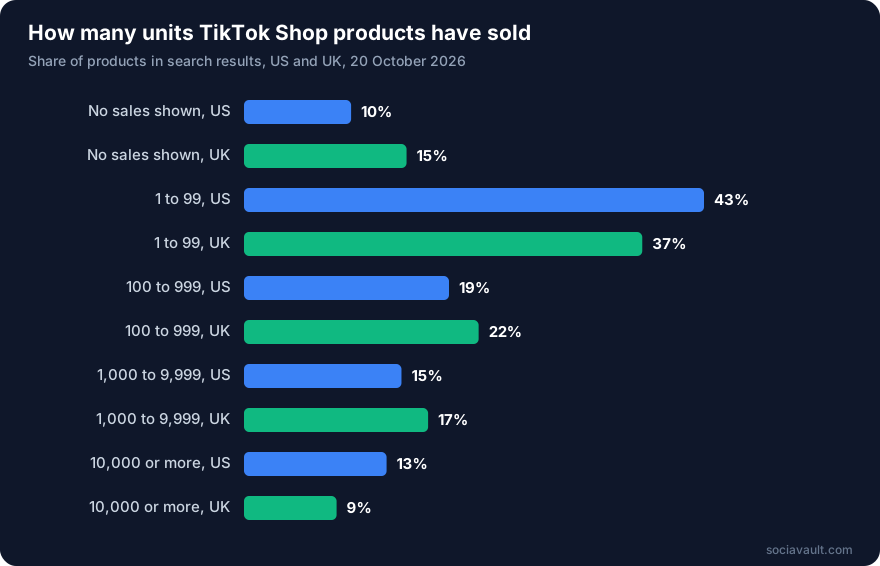
The top 10% of products accounted for 91% of units sold in the US and 89% in the UK. More than half of all products, 53% in the US and 52% in the UK, had sold fewer than 100 units.
Products with creator videos had sold far more
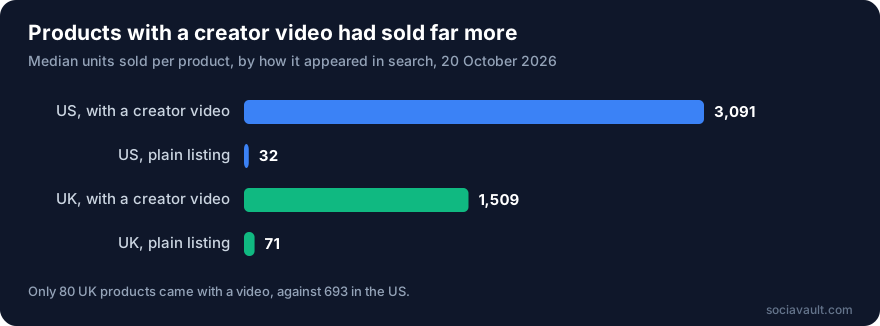
In the US, 23% of search results came with a creator video. Those products had sold a median of 3,091 units, against 32 for plain listings, and accounted for 62% of all units sold. The gap held in all 15 categories, at 16 times or more.
The UK discounts more often and deeper
51% of UK listings showed a discount, against 31% in the US. One UK listing in ten was 60% or more off, against about one in a hundred in the US.
Discounts went with sales in the UK, not clearly in the US
In all 15 UK categories, discounted listings had sold more than full-price ones. In the US, that was true in 8 of 15.
Cheap didn't mean popular in the US
In every US category, the cheaper half of listings had sold less than the pricier half. Listings under $5 had sold a median of 7 units, and listings at $40 or more had sold 1,006.
Search position mattered in the UK
The first ten UK results had sold a median of 250 to 330 units, against 37 below the twentieth. In the US, position made no consistent difference, with creator videos spread evenly down the results.
The Dataset
We ran 60 product searches in each country, four per category, using generic product types with no brand names. For every result on the first page we recorded the price, any original price, the rating, units sold, the free shipping label, and whether the result came as a creator video. Because TikTok shows a partly different set of products on every request, each search ran twice, an hour apart, and the two pulls were pooled.
| Date | 20 October 2026 |
| Countries | United States, United Kingdom |
| Categories | 15, with four searches each |
| Searches | 240 (120 searches, run twice) |
| Search results read | 7,313 |
| Unique products | 6,057 (3,023 US, 3,034 UK) |
| Sellers | 3,841 (2,028 US, 1,813 UK) |
What is deliberately not in this report
- No named sellers or products. Every figure is an aggregate by country, category or band.
- No logged-in data. Everything comes from public search results and listings.
- No revenue estimates. Units sold are reported as shown, never converted into sales value.
| Overview | US | UK |
|---|---|---|
| Products | 3,023 | 3,034 |
| Sellers | 2,028 | 1,813 |
| Median price | $17.30 | £8.83 |
| Middle half of prices | $7.99 to $33.99 | £2.72 to £16.75 |
| Listings showing a discount | 31% | 51% |
| Median discount, when discounted | 41% | 46% |
| Free shipping or delivery | 88% | 58% |
| Products with a rating | 54% | 51% |
| Median units sold | 79 | 77 |
| No sales shown | 10% | 15% |
| Sold 10,000 units or more | 13% | 9% |
| Top 10% share of units sold | 91% | 89% |
| Results with a creator video | 23% | 3% |
Prices in local currency. A product that appeared in several searches counts once per country.
Who Sells and Who Doesn't
In the US, 43% of products had sold between 1 and 99 units, and another 10% showed no sales at all. At the other end, 13% had passed 10,000 units, and the top 10% of products accounted for 91% of everything sold. The median product had sold 79 units in the US and 77 in the UK.
Products With Creator Videos Had Sold Far More
TikTok Shop search mixes plain product cards with results that show the product inside a creator's video. In the US, 23% of results came that way, spread evenly down the page. In the UK, 3%. Video results were 23% of US products but 62% of all units sold, and 237 of the 402 US products past 10,000 units came with one.
| Category (US) | With a creator video | Plain listing |
|---|---|---|
| Jewelry and accessories | 10,908 | 5 |
| Womenswear | 6,943 | 35 |
| Makeup | 5,613 | 105 |
| Skincare | 4,792 | 82 |
| Phones and electronics | 4,120 | 68 |
| Hair care | 3,575 | 32 |
| Home | 3,320 | 36 |
| Baby | 3,110 | 34 |
| Health and supplements | 2,712 | 111 |
| Toys | 1,828 | 10 |
| Shoes | 1,808 | 108 |
| Pets | 1,348 | 8 |
| Menswear | 1,295 | 22 |
| Kitchen | 716 | 24 |
| Sports and outdoors | 626 | 11 |
Median units sold per product. Every category had at least 25 results with a video.
Which way does it run?
We can't tell. Creators pick products that already sell, and a product with a few hit videos attracts more. This doesn't mean a video multiplies sales 97 times. It does mean the products that sell on TikTok Shop in the US are mostly the ones creators make videos about.
How Often Listings Show a Discount
A listing counts as discounted when it shows an original price above its current price. Nearly a third of US listings did, and about half of UK listings. When a US listing was discounted, the median was 41% off, and more than half sat between 40% and 59% off. UK discounts ran deeper, at 46% at the median, with one listing in ten at 60% or more off.
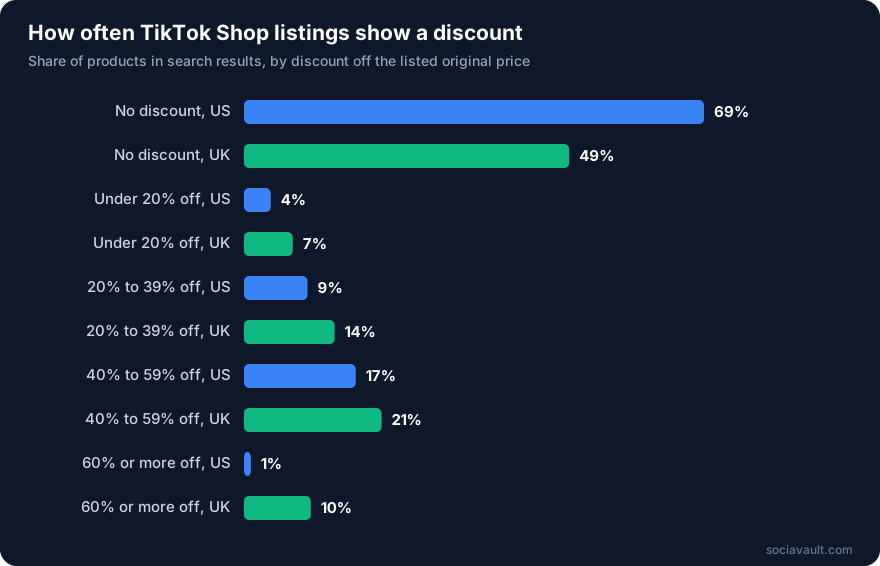
In the UK, discounts went with sales: in all 15 categories, discounted listings had sold more than full-price ones, often many times more. In the US the pattern was mixed, with discounted listings ahead in 8 of 15 categories.
Category by Category
Makeup was the US best seller by a distance, and the category most likely to come with a creator video. Supplements were the UK best seller, with 78% of listings discounted. Kitchen was the most expensive category in both countries.
| Category | US price | US disc. | US units | US video | UK price | UK disc. | UK units |
|---|---|---|---|---|---|---|---|
| Makeup | $14.00 | 24% | 883 | 38% | £4.00 | 46% | 164 |
| Skincare | $17.97 | 35% | 107 | 16% | £9.58 | 56% | 422 |
| Hair care | $19.55 | 23% | 84 | 23% | £10.15 | 60% | 61 |
| Health and supplements | $32.47 | 17% | 321 | 26% | £11.64 | 78% | 516 |
| Womenswear | $18.00 | 24% | 87 | 31% | £12.82 | 65% | 222 |
| Menswear | $15.95 | 23% | 51 | 19% | £15.05 | 50% | 128 |
| Shoes | $17.37 | 43% | 194 | 26% | £11.42 | 48% | 94 |
| Jewelry and accessories | $5.75 | 32% | 13 | 24% | £5.56 | 44% | 26 |
| Home | $22.82 | 33% | 96 | 26% | £8.15 | 50% | 98 |
| Kitchen | $35.99 | 37% | 60 | 24% | £24.40 | 57% | 24 |
| Phones and electronics | $10.98 | 35% | 163 | 19% | £4.90 | 44% | 96 |
| Toys | $12.16 | 34% | 23 | 16% | £5.52 | 52% | 49 |
| Pets | $16.41 | 35% | 11 | 14% | £5.68 | 43% | 33 |
| Baby | $17.28 | 48% | 83 | 27% | £6.91 | 38% | 51 |
| Sports and outdoors | $21.90 | 31% | 21 | 17% | £6.99 | 42% | 10 |
Median price and median units sold per product; share of listings showing a discount; share of US results that came with a creator video.
Cheap Didn't Mean Popular
In every US category, the cheaper half of listings had sold less than the pricier half. In the UK that held in 12 of 15 categories, and listings at £40 or more sold little. We can't say why from this data. It fits products with a following, reviews and creator videos behind them pricing higher.
| Price ($ in the US, £ in the UK) | US products | US median units | UK products | UK median units |
|---|---|---|---|---|
| Under 5 | 16% | 7 | 35% | 33 |
| 5 to 10 | 16% | 21 | 21% | 90 |
| 10 to 20 | 24% | 47 | 25% | 202 |
| 20 to 40 | 24% | 680 | 12% | 190 |
| 40 or more | 19% | 1,006 | 8% | 26 |
Search Position Mattered in the UK
UK results near the top of a search had sold several times more than results further down. In the US there was no consistent pattern. With creator videos spread evenly through US results, a strong seller can sit anywhere on the page.
| Position in search | US median units | UK median units |
|---|---|---|
| Results 1 to 5 | 88 | 252 |
| Results 6 to 10 | 88 | 328 |
| Results 11 to 20 | 59 | 65 |
| Results 21 and below | 82 | 37 |
What This Means for Sellers and Brands
Plan for the long tail
More than half of listings had sold fewer than 100 units. Listing is easy; getting out of the tail is the hard part. Test demand before stocking deep.
In the US, creators are the clearest common thread
Products with creator videos made up 62% of US units sold. We can't show that videos cause sales, but a product nobody films is competing in the long tail.
Don't race to the bottom on US prices
The cheaper half of listings sold less in every US category. A low price alone didn't get products bought.
In the UK, plan a discount
About half of UK listings show one, and discounted listings sold more in every category. A full-price listing is the exception there.
Track competitors by units sold
Units sold are public on listings, so a rival's products can be followed week by week. The difference between two snapshots is a sales estimate for the period.
Black Friday Follow-up
Listed discounts don't show what really happens to prices. So we're following a fixed panel of 300 US products, 20 per category, all with at least 100 units sold. On 20 October we recorded their current prices, original prices, prices by variant, stock and units sold.
We'll record the same products again in Black Friday week (27 November) and rerun the searches in both countries. That will show how far prices actually fall, how many products discount at all, and how many units the panel sells in between. The update will be added to this report in early December.
Limitations
1.Search results, not the whole catalog
TikTok decides what ranks first for a search, and it likely favors products that already sell. The real long tail is longer than what we saw.
2.Results change from one request to the next
Only 40% of the US products in our first pull appeared again in a second pull an hour later, and 27% in the UK. We pooled both pulls. Each pull alone gave similar headline figures: the top 10% held 93% of US units in one and 90% in the other.
3.Units sold are lifetime counts
Older listings have had more time to sell. Counts are as displayed on the listing and include every variant. We can't see revenue, returns or refunds. A missing count is treated as zero; only 5 of the 762 products without one had a rating.
4.Listed discounts aren't a price history
Sellers set their own original prices, so a listing showing 50% off may never have sold at the higher price. The Black Friday follow-up measures real price changes on the same products.
5.Correlation, not causation
Creators choose products that already sell, and popular products attract more videos. The video, price and discount patterns describe what goes together, not what causes sales.
6.The categories are ours
Each category is four generic product searches with no brand names, such as "lip gloss" or "air fryer". A different set of searches would give somewhat different figures.
7.One day, two countries
All searches ran on 20 October 2026 in the US and UK. A few searches came back empty on one pull, and "knife set" returned nothing in the UK both times.
Data Availability
The aggregated tables behind this report, including the overview, every category, units sold and discount bands, creator video comparisons, search position and price bands, are free to download and reuse with a link back to this page.
Download the CSVHow to cite: SociaVault Labs (2026). The State of TikTok Shop 2026. https://sociavault.com/labs/reports/tiktok-shop-2026
For a specific cut of the figures or methodology questions, contact labs@sociavault.com. To pull the same data yourself, see our TikTok Shop API guide.
Run these numbers on your own category
Every figure here comes from the SociaVault TikTok Shop endpoints. Start with 50 free credits, no card required.